


Recognising this shift, Racecourse Media Group partnered with Ellipse to create RaceiQ. The project aims to bring horse racing to a modern, data-savvy audience, utilising Ellipse’s extensive data science, engineering and machine learning capabilities to provide insights that engage new and existing fans of the sport.
Two years into the project, RaceiQ is now a regular part of the ITV and RacingTV output, enriching coverage and uncovering angles that were previously reserved for more experienced viewers. The metrics are all powered by detailed GPS trackers, with two carried on every horse in every race across Britain and Ireland. Now that they are free to view in the results section of the RacingTV website, RaceiQ data brings fans and participants even closer to the action.
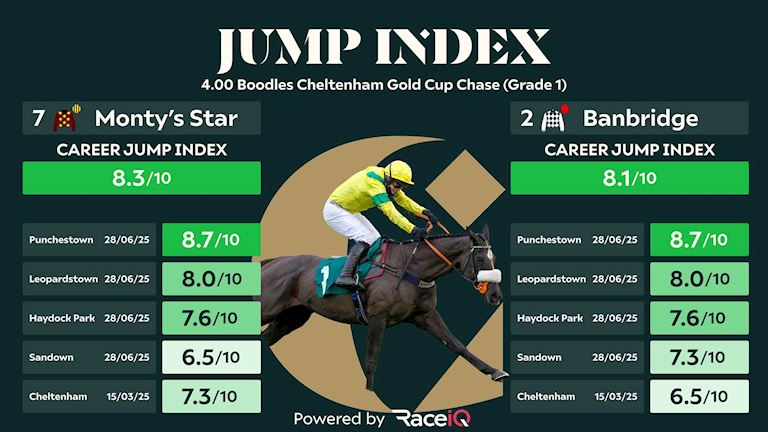
Two of the RaceiQ metrics, Jump Index and Lengths Gained Jumping, proved invaluable last season when analysing past and future form at the Cheltenham and Aintree Festivals.
One such example was Ballyburn. There was much debate about how his jumping would hold up in the Brown Advisory Novices’ Chase. His career Jump Index of 6.8 out of 10 before the race was lower than all but one of his rivals, which supported the common view that his jumping needed to improve.
It proved his Achilles' heel on the day.
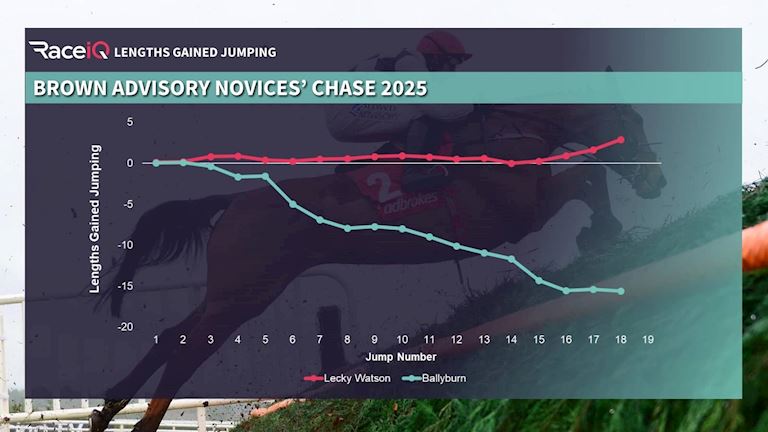
In the race, he scored a Jump Index of 5.8 out of 10, which was the worst of the seven runners. The Lengths Gained Jumping metric then quantified the impact of this poor jumping, highlighting that despite only finishing eight and a half lengths behind the winner, Lecky Watson, he forfeited nearly 20 lengths to him through slow jumping in the race.
This ability to quantify a horse’s advantage or disadvantage through jumping is revolutionary and offers just a glimpse of the clarity that the RaceiQ metrics can deliver to horse racing. Along with other metrics such as stride data, Par Time, and 0-20mph from the stalls, it makes race analysis more accessible for all viewers, regardless of their experience.
Cheltenham are very much looking forward to using RaceIQ graphics on the Big Screens on racedays this coming season, for the first time. For each race, you will be able to see horse, jockey and eventually trainer data to enable you to make a more informed decision if you are betting or simply out of interest if you are a more casual racegoer. The Racecard will explain in greater detail how the Jump Index is arrived at, and how the other stats impact on performance and how to understand them.


